


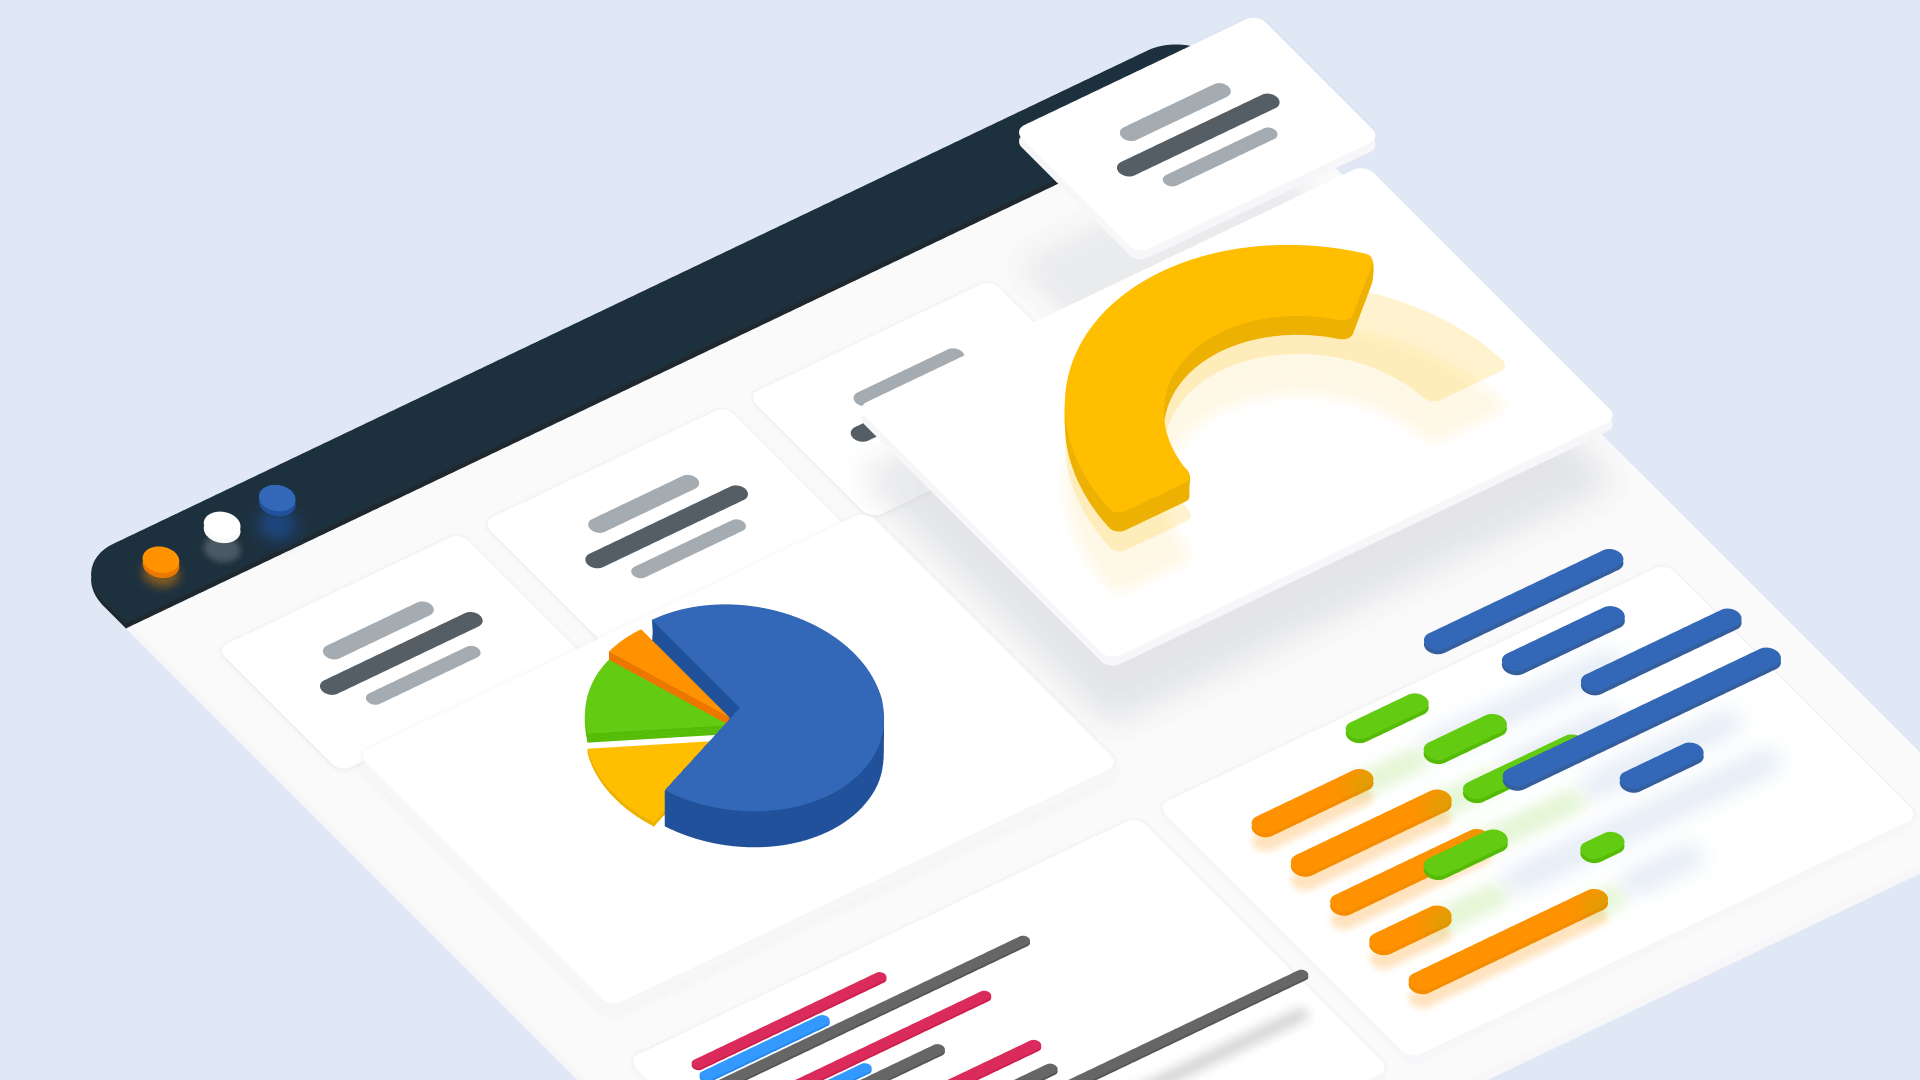
CRM Dashboard: What is it? [Examples, Benefits, Report Types]
OnePageCRM has recently released an interactive Dashboard. You can now easily visualize your sales progress, track KPIs, and monitor team performance.
For those of you who are not familiar with CRM Dashboards, here’s a short introduction to what this tool can do, how it can help your business grow, and what you can use it for.
What is a CRM Dashboard?
If you’ve worked with spreadsheets before, you’re probably no stranger to dashboards.
To put it simply, a dashboard is a visual representation of data, and a CRM dashboard is a visual representation of CRM-related metrics, such as the number of contacts created, sales deals closed, and so on.
CRM dashboards are usually interactive, easy to use, and highlight the most important metrics. Depending on the size of your company and the complexity of your processes, you might use either highly customizable dashboards or a very simple layout.
Why is a CRM Dashboard important?
Here are a few benefits of CRM Dashboards:
- Dynamic reporting
- Improved goal tracking
- Quick business overview
- Intuitive interface
- Sales pipeline monitoring
- Proactive approach
- Efficiency
Dynamic reporting
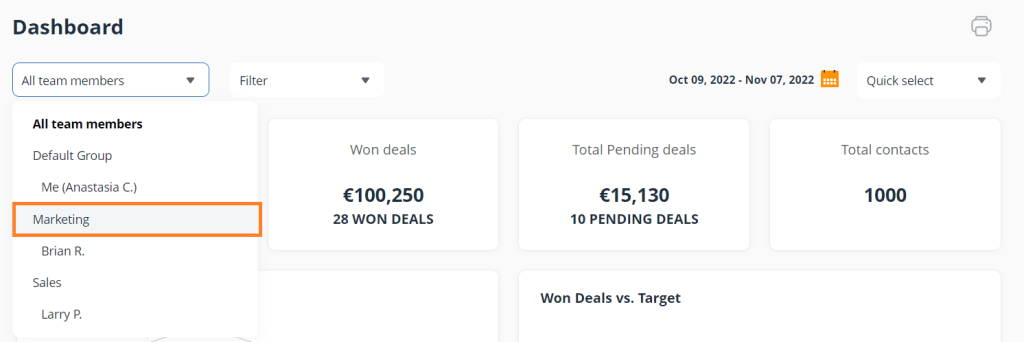
Choose whether you want to zoom into or out of a metric. You can build a Dashboard for a team, an individual, or a specific time period.
If you use tags to segment your client database into different projects, you can also drill down into data associated with these tags. For example, some businesses use tags for lead sources to keep track of where their leads came from. With a CRM dashboard, you can then see how the sales stats differ from tag to tag.
Besides, if different teams use one CRM (for example, marketing and sales), you can create two User Groups and monitor the performance of each team.
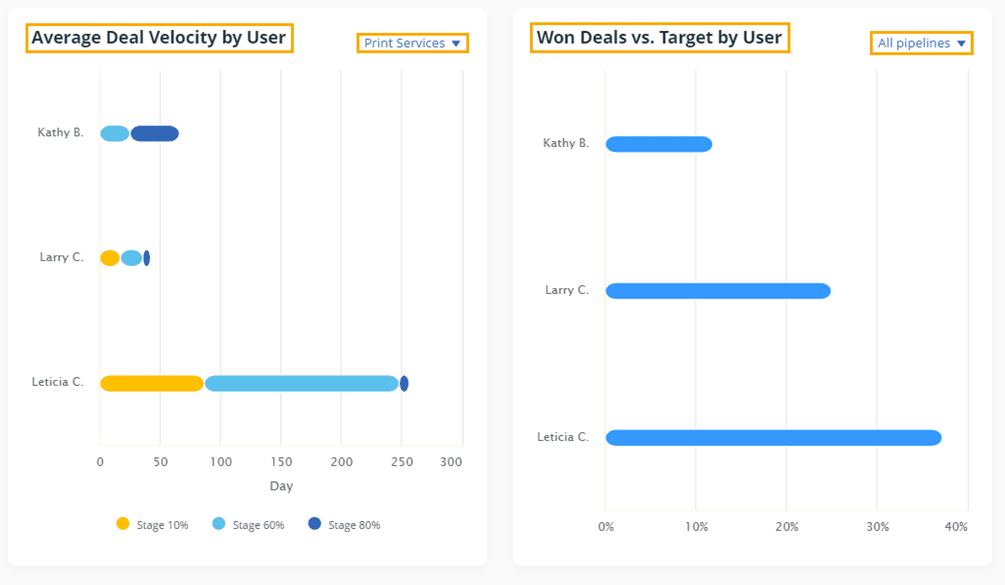
Improved goal tracking
With a CRM Dashboard, while individual users can have a better visualization of their progress, Administrators and Account Owners can monitor the whole team’s performance.
For example, by looking at the average deal velocity per user, you can understand whether some of your team members struggle with closing deals and need help.
Quick business overview
A CRM Dashboard allows users to have a quick snapshot of what’s happening in their business or in different teams. You can use this simple reporting tool to track progress and course-correct when needed.
Intuitive interface
Dashboards should make your life easier. For example, with OnePageCRM, you don’t need to build a Dashboard from scratch. The system creates it for you and you can feed in data depending on what insights you need. This clean display helps you focus on the metrics that matter the most for your business.
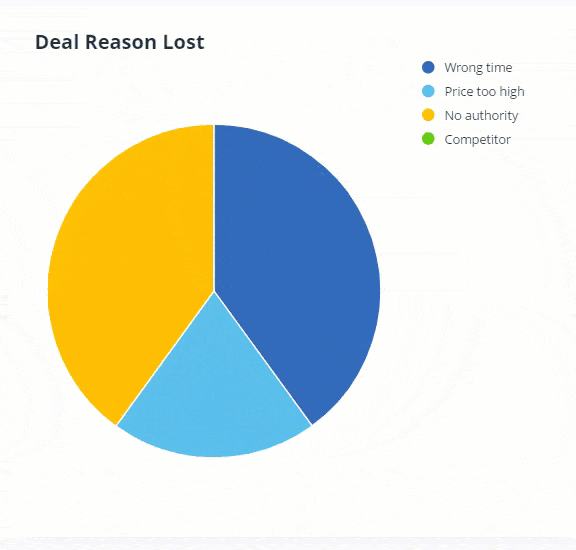
Sales pipeline monitoring
In OnePageCRM, you can see the reasons for lost deals.
For example, if some reasons are relatively high this month, you can start asking questions and dig deeper into the current state of your sales pipeline.
Proactive approach
Having a look at a CRM Dashboard on a daily basis can become a habit. Action-focused discussions around metrics and data will positively influence your team’s performance and company results. And one of the great things about OnePageCRM is that the whole system is built on an action-focused approach: starting from the Action Stream to CRM Dashboard and emails.
Efficiency
To make the most of your CRM Dashboard, make sure that the team records data diligently and that there is no missing information. This way, you can easily track and visualize your progress throughout the year. Besides, with OnePageCRM, many repetitive tasks can be automated which will free your time for value-added activities.
Report types in a CRM Dashboard
You can find different types of stats in your CRM Dashboard:
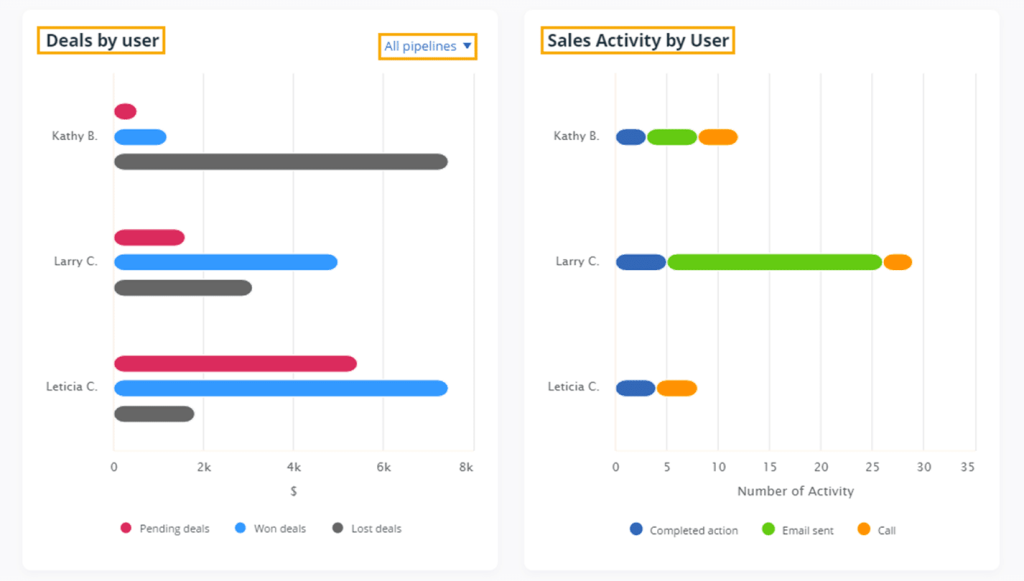
- Sales pipeline reports. Display all information about deals in one place: the number of deals created, closed, pending, lost, and the monetary amounts associated with these deals.
- Contact management reports. While your business is growing, you might want to keep an eye on the number of new clients added every month. In your CRM Dashboard, you can see the number of contacts owned by a particular user and track how many new prospects they bring.
- Team activity reports. As an Account Owner or an Administrator, you can drill down further and see activities for the whole company, team, or individual. For example, you can have a look at how many deals each user has, their status, the number of completed tasks, sent emails, calls, etc.
- Goal tracking reports. In your CRM Dashboard, you can also see the number of won deals and how this number compares against the targets set in your Pipeline.
A glimpse into your CRM activities
A simple CRM Dashboard can give you a glimpse into how your business is doing and whether you need to improve any processes. It has only the necessary graphs and charts without overcomplicating your CRM usage. Besides, you don’t need to build these graphs in Excel or Google Sheets, you can easily log into your CRM account and have a look at the stats.
Want to learn more about how OnePageCRM’s Dashboard works? Check out this Help article.
If you have any questions or comments, drop us a line at support@onepagecrm.com.


