Simple and customizable CRM reporting
See how the team is doing, and build the reports that actually make sense to you.

Make better decisions with simple CRM reports
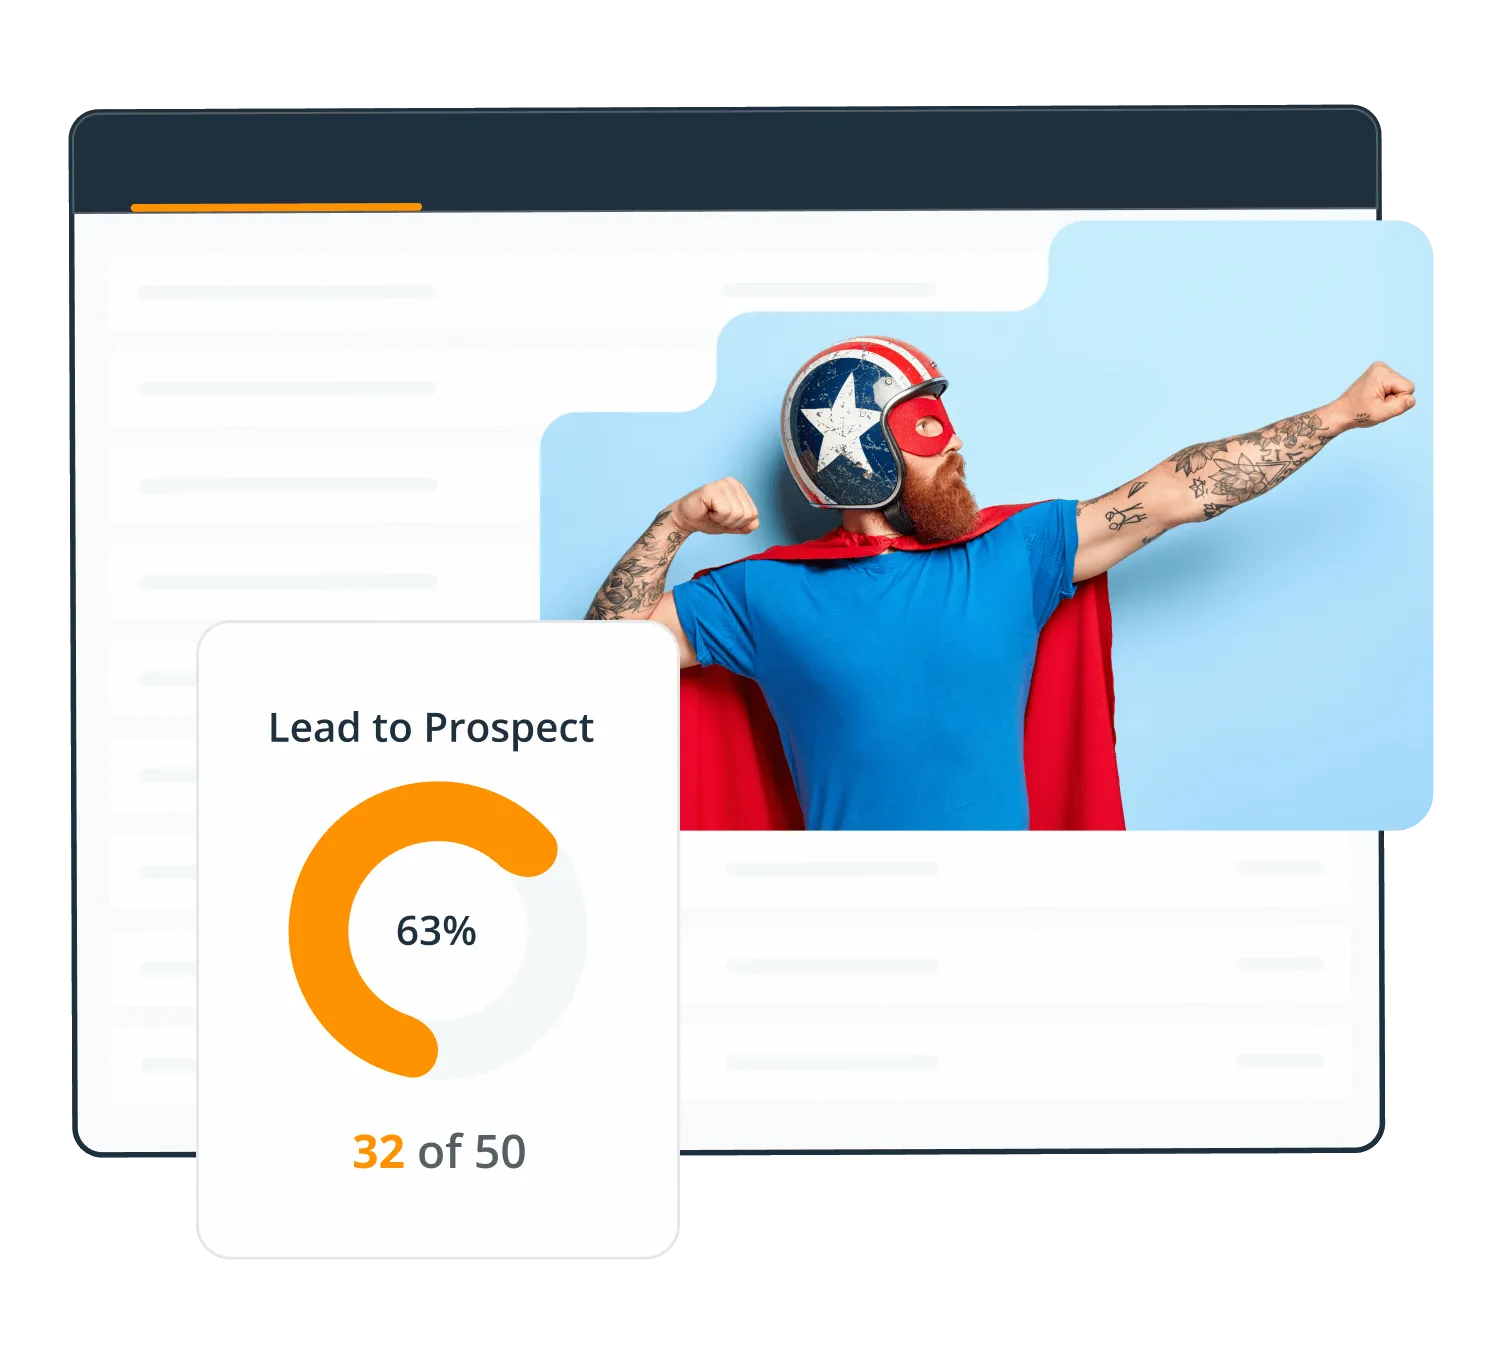
Stay on top of your targets
Set a target for the number you are chasing: conversions, calls, meetings, or revenue. Then pick whether it runs by the day, the week, or the quarter.
The widget sits in your Action Stream and fills up as you go, so progress is in front of you rather than in a report you have to go and find.
Have a full view of your business
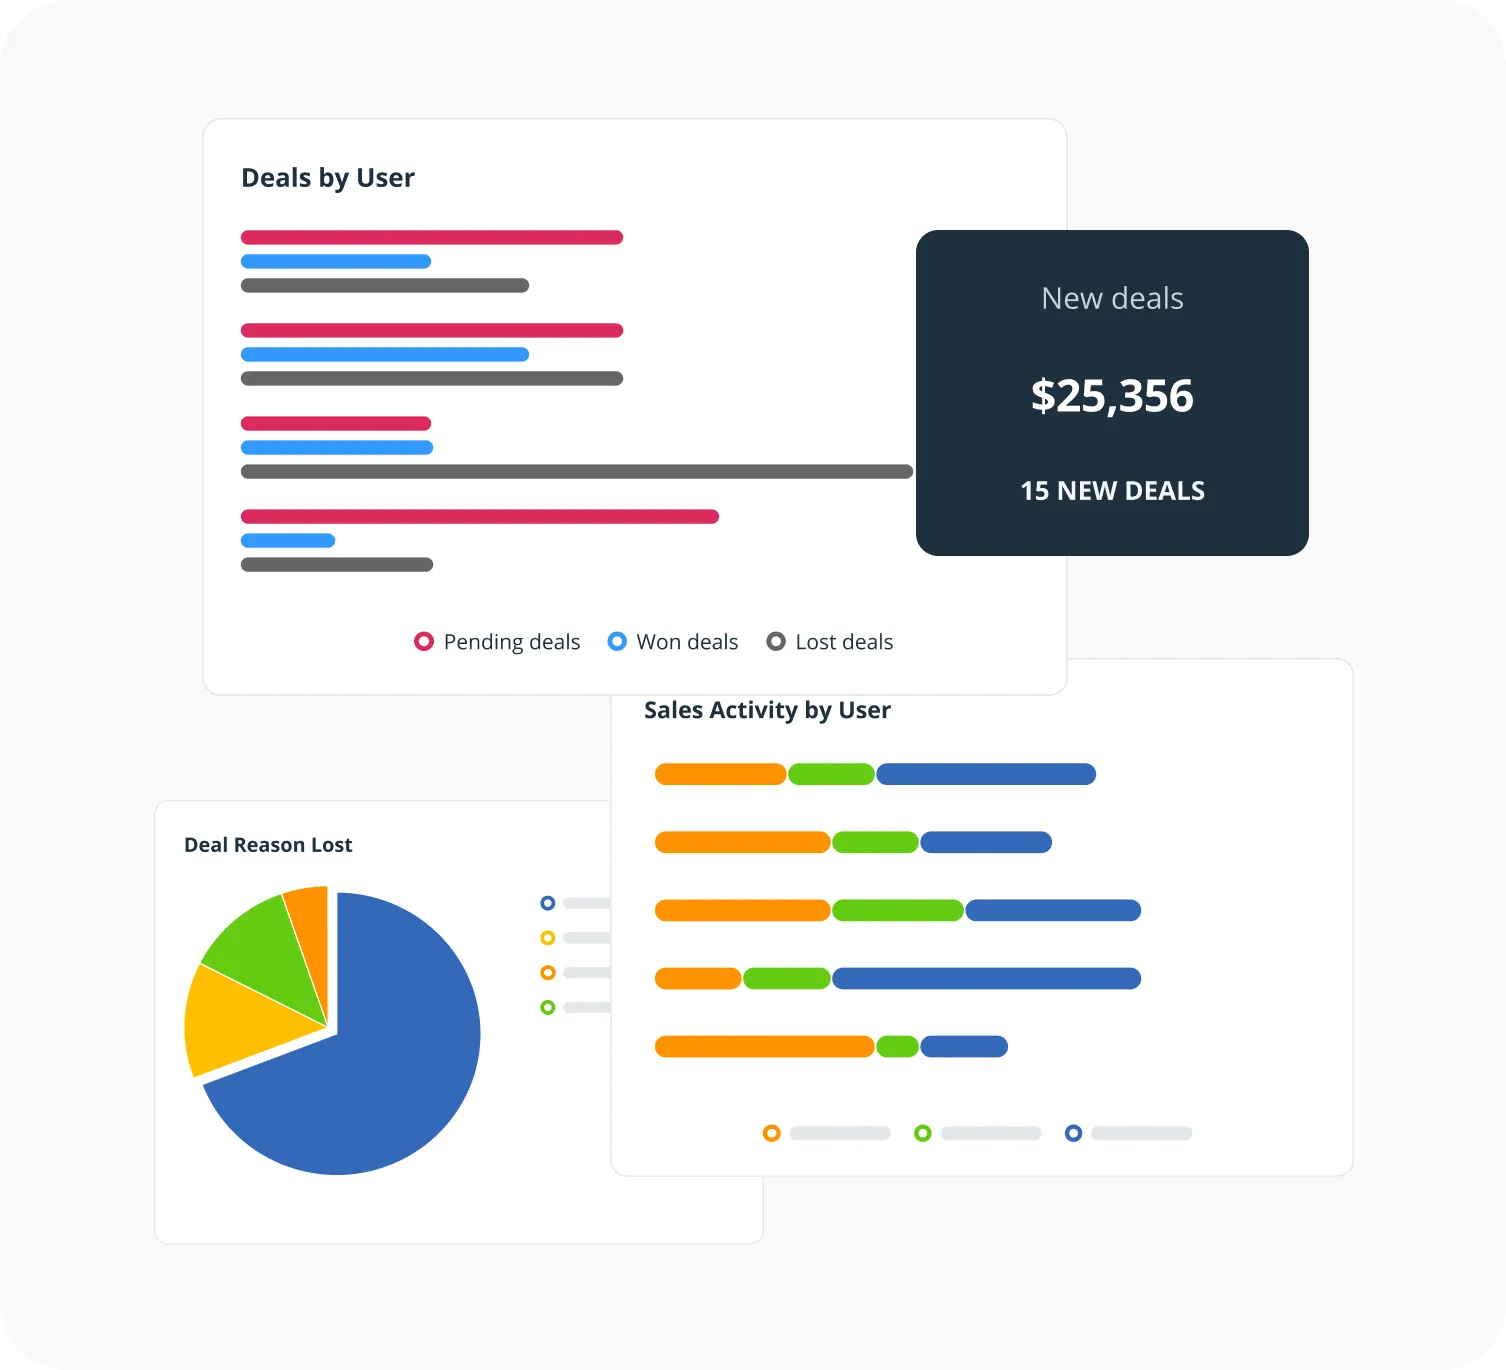
The Dashboard turns the week into five charts: won deals against target, deals and activity by person, and how long deals are taking to move.
Filter it by team member, group, tag, or timeframe to see whose numbers need a conversation.
Custom reports
Pick your metrics, a date range, and how to group them. Save the report and run it again next month.
Scheduled reports
Have a report land in your inbox, or your accountant’s, on whatever schedule you set.
Activity feed
Every note, call, meeting, deal, and email across the team, in one list, newest first.
Export
Take any report out as a CSV or an Excel file when somebody needs it in a spreadsheet.
AI reporting
Connect your CRM to Claude or ChatGPT and ask for any breakdown you want, in plain language.
Conversion tracking
Count how many leads turned into prospects, and prospects into customers, over any period.
What others say

“Half of my sales team works remotely, so a very important way for me to manage them is to track their activity in the CRM system. If my team haven’t logged in a note or a call with a client, I consider it to not have happened…”
Ciara Crossan · Founder and CEO at Wedding Dates
“It’s near impossible to let any relationship fall through the cracks.”
 Lauren AyersGoogle review
“I particularly like the full Outlook email integration, especially the open tracking feature.”
 Phil KGoogle review
“This without doubt the easiest, most intuitive CRM I’ve ever used.”
 Mike ShivleyGoogle review
“…remarkable in its combination of power and simplicity.”
 Tom PressmanGoogle review
“OnePageCRM is like having an assistant I don’t have that gets our sales on a priority list, reminds me of what I need to do daily…”
 Geoff FlynnCreative and Operations Director at Brand Blue
“With OnePageCRM, I know what I need to do next with my leads or existing customers.”
 Petter Frøshaug VasholmenGoogle review
“It offers everything I was looking for to help organize my contacts and build a usable database…”
 Joseph CascianiGoogle review
“OnePageCRM had everything we needed, without all the bloat.”
 Jason KneppGoogle review
“The ability to complete, track, schedule and make sense of calls, emails and interactions makes thinking about selling more productive and profitable…”
 John KlymshynGoogle review
“I find OnePageCRM to be far more user-friendly and with a much easier learning curve.”
 Kelly MainForbes Advisor
“…the best balance of cost and functionality goes to OnePageCRM.”
 Ross GolenGoogle review
“…everyone on our team can pick up where any of us left a conversation because of the ability to keep detailed notes in OnePageCRM.”
 Bret BicoyGoogle review
“…this simple extremely effective CRM tool to get organized and free up your brain space.”
 Sally EltzerothGoogle review
“OnePageCRM was so easy to use and get started.”
 Margo CrawfordProductivity Coach at Wave Productivity
“The customer support provided by the OnePageCRM team is unparalleled!”
 Jennifer WaldenGoogle review
Frequent questions
CRM reporting turns what your team does every day into numbers you can look at together: calls, emails, meetings, notes, and deals won and lost.
For a small business it usually answers three questions. Is the team busy enough? Are the deals moving? And will this month land where we need it to?
Custom Reports cover user activity, new and deleted contacts, status conversions, calls broken down by result, deals (new, won, lost, commission, and margin), actions, notes, and emails sent and received.
Pick a date range. All time, year to date, last year, or a quarter, month, week, or a range of your own. Then group by user and segment by year, quarter, or month.
Save the report and it is there next time. You can also have it emailed out on a schedule, or export it as a CSV or an Excel file.
Five charts: won deals against target, deals by user, sales activity by user, average deal velocity by user, and won deals against target by user.
Filter the whole thing by team member, User Group, tag, or timeframe, and print it from the printer icon when somebody wants it on paper.
You are not limited to it either. Connect an AI assistant to your CRM and you can have it pull your numbers and build a custom dashboard of your own, laid out however you want to read it.
Yes. OnePageCRM connects to Claude, ChatGPT, Perplexity, Grok, and other AI assistants that support MCP, so you can ask questions about your own CRM data in plain language and get an answer back.
Ask which deals have gone quiet, how a particular month compared to the last one, or who has not been contacted in six weeks. The AI assistant reads your CRM to answer, so the numbers are yours rather than a guess.
It works on the free trial and on every paid plan. You choose whether the AI assistant can only read your data or also update it when you connect it.
There are two kinds, and they do different jobs.
The Targets Widget is personal. Set a goal for conversions, calls, meetings, or revenue, choose whether it runs daily, weekly, monthly, quarterly, or yearly, and it sits in your Action Stream filling up as you work.
Pipeline targets are set per team member and show in the Forecast View, so a manager can see the whole team against their numbers in one place.